Justyna Lemke, MA, Maritme University of Szczecin, This email address is being protected from spambots. You need JavaScript enabled to view it., Wały Chrobrego 1-2, 70-500 Szczecin.
Małgorzata Łatuszyńska, Professor, University of Szczecin, This email address is being protected from spambots. You need JavaScript enabled to view it., Mickiewicza 64, 71-101 Szczecin.
Abstract
The purpose of this artcle is the analysis of the system dynamics model validaton illustrated by the example of a model of the manufacturing resource allocaton. In the frst part of the artcle the authors present an overview of the defnitons of validaton and verifcaton that can be found in the reference literature. Also, they emphasize the role which validaton and verifcaton play in the modeling process. Furthermore, they discuss the techniques of system dynamics model validaton with partcular focus on tests of the model structure, behavior and policy implicatons. The second part of the artcle contains an example of the validaton process of a system dynamics model simulatng manufacturing resource allocaton in an electronic company. The purpose of the model is to assess the long-term effect of assigning workers to individual tasks on such producton process parameters as efciency or effectve work tme. The authors focus their partcular atenton on that part of the model which deals with a storehouse, one of the company producton units. They conduct tests of its structure and behavior. When validatng the structure the authors make use of the informaton obtained in a series of interviews with the company staff. They also refer to the generally accepted knowledge found in the reference literature. The results generated by the model in the course of the behavior tests are compared with the real data. The authors evaluate both the logic of the system behavior and the level of accuracy of the output data in reference to the real system.
Keywords: validation of simulation models, system dynamics.
Introducton
Nowadays simulaton is commonly used in many areas of business management. It is applied to forecastng as well as to understanding mechanisms within companies. Simulaton models can be partcularly helpful for minimizing wrong decision-making. It must be noted, however, that the model that is to satsfy the user’s requirements has to meet quality standards regarding both the sofware and the accuracy of its representaton of reality. This is why among many stages of creatng a simulaton we can fnd its verifcaton and validaton (Maciąg, Pietroń & Kukla, 2013, p. 161). It is an essental, but controversial (Barlas, 1996, p. 183) and stll unsolved (Marts, 2006, p. 39) aspect of modeling methodology. The quality of a study conducted by means of a simulaton model largely depends on its validaton.
The purpose of this artcle is the analysis of the system dynamics model validaton illustrated by the example of a model of the manufacturing resource allocaton.
Literature review
One of the difcultes hindering the process of verifcaton and validaton lies in the understanding of both terms. Some authors claim that there is no need to differentate between the two – for instance Pidd sees verifcaton and validaton as synonymous (Pidd, 1998, p. 33). But, as shown in Table 1, most authors recognize verifcaton as different from validaton.
| Verifcaton | Validaton | Source |
|---|---|---|
| Testng if the symbolic (formal) model has been properly transformed into its operatonal form (e.g. a computer program). | Proving that in the experimental environment the accuracy of the operatonal model (usually a computer one) is satsfying and in keeping with its intended use. | (Maciąg, Pietroń & Kukla, 2013, p. 162) |
| Testng if the computer program of the computerized model and its implementatons are correct. | Proving that within its applicaton domain the computerized model has a satsfying level of accuracy which is in keeping with its intended use. | (Sargent, p. 166) |
| Testng a seemingly correct model by its authors in order to fnd and fx modeling errors. | An overview and assessment of the model operaton performed by its authors and by experts in the feld in order to fnd out if the model with a satsfying level of accuracy represents the real system. | (Carson, 2002, p. 52) |
| The process of ascertaining if the implementaton of the model (the computer program) represents precisely the concept authors’ descripton and specifcaton. | The process of deciding on the assessment method as well as the very assessment of the level to which the model (its data) represents the real world from the perspectve of its intended use. | (Davis, 1992, pp 4-6) |
Verifcaton is regarded as a necessary, yet insufcient stage of model assessment, while validaton is considered – in its narrower sense – to be one of the assessment stages, or – in a broader approach – the very assessment itself (Balcerak, 2003, pp 27-28).
Despite the differences, the above quoted defnitons have something in common. Verifcaton is typically conducted by the author of a model and refers to a computer program. In other words, it is the process of checking if the program is free from formal, ‘technical’ faults, while validaton is a more complex issue – it results in determinaton if and how well the model represents the reality.
Consequently, if a computer program is to be working properly and a model should represent the reality, a queston must be asked when it should be tested in the course of modeling. The tme to perform the tests is another queston to be answered by a modeler. Various authors suggest, following Sargent’s paradigm (Sargent, Verifcaton and Validaton of Simulaton Models, 2010), that verifcaton and validaton should be run parallel during the modeling process and that validaton should refer to data as well as to two models: the computer model and the conceptual one (see Figure 1).
The purpose of the conceptual model validaton is to answer the queston whether the model includes the appropriate number of details to meet the simulaton objectve, while the purpose of the data validaton is to fnd out if the data used in the model is accurate enough. In case of a computer model, its validaton, called the operatonal validaton, answers the queston whether the model adequately represents the real system. Robinson (Robinson, 1997, p. 54) recommends testng individual parts of the model (White-box Validaton) and the model as a whole (Black-box Validaton).
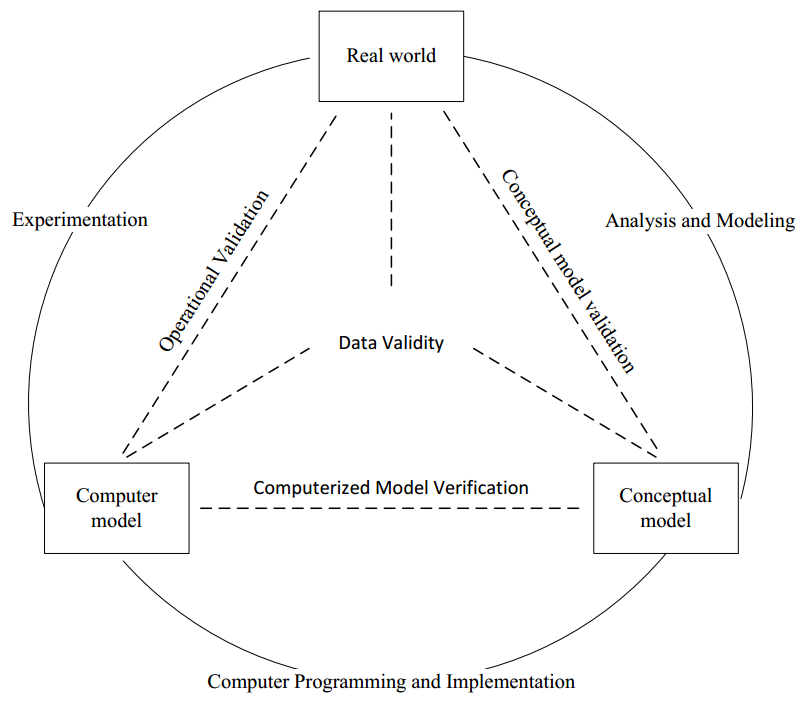
Source: own study on the basis of (Sargent, 2010, pp 1
Another problem to be faced by those who are assessing the model is the reality representaton. The queston is what this means. According to Khazanch (Marts, 2006, p. 43), a conceptual model can be considered validated, hence adequately representng the real world, if it is:
- plausible,
- feasible,
- effectve,
- pragmatc,
- empirical,
- predictve,
- inter-subjectvely certfable,
- inter-methodologically certfable.
It is essental to choose the validaton methods that are adequate for the model purpose. Depending on the reference point for the data generated by the system or on the modeling objectve, various authors recommend testng the descriptve, predictve or structural validity (see: (Balcerak, 2003, p. 37); (Davis, 1992, pp 7-8)). It is worth notng that it is not necessary to test all the three conditons. Therefore, if, for instance, the purpose of the model is to fnd out why productvity in a company has been falling, there is no need to check if the data supplied by the model is going to correspond to the values that the company will generate in the future.
Model testers have at their disposal various techniques that help answer the above questons. Balci (Balci, 1986, p. 6) divided these techniques into two basic groups: the statstcal and the subjectve ones. The former include the variance analysis and the linear regression, while the later comprise the comparison with other models, degeneraton tests, event validaton, historical data validaton or the Schellenberg criteria. The lists and descriptons of these methods can be found in: (Marts, 2006; Balci, 1986; Jaszkiewicz, 1997, pp 193-199; Davis, 1992, pp 18-25). Further in the artcle its authors present those techniques that are recommended in the literature as useful for the validaton of system dynamics models.
Research methods
As mentoned above, the choice of methods depends primarily on the purpose of the model. Therefore, when recommending tests for models built in the System Dynamics (SD) conventon, we should frst of all defne their characteristcs.
System Dynamics is a method of contnuous simulaton developed by J. W. Forrester and his associates at Massachusets Insttute of Technology during the late 1950s and early 1960s. Informaton about its assumptons and applicaton can be found in numerous publicatons, such as (Campuzano and Mula, 2011, pp 37-48; Łatuszyńska, 2008, pp 32-77; Maciąg, Pietroń and Kukla, 2013, pp 182-212; Ranganath, 2008; Tarajkowski, 2008, pp 33-163). As far as the choice of validaton methods is concerned the most important thing, apart from the contnuity of the modeled systems, is that the modeler’s principal aim is the examinaton of their dynamic propertes. At the same tme, it should be noted that the above mentoned dynamics results from the system structure and from periodic regulatory procedures (Maciąg, Pietroń i Kukla, 2013, p. 184).
In view of the above mentoned propertes of the system dynamics models, Sterman (Sterman, 1984, p. 52; Sterman, 2000, pp 858-889) suggests validatng a model in the context of its structure, behavior and the implicatons of the user’s policy. Tests recommended for each of the groups and the related problems are presented in Table 2.
| Test | Problem |
|---|---|
| Tests of Model Structure | |
| Structure Verifcaton | Is the model structure consistent with the present state-ofthe- art? |
| Parameter Verifcaton | Are the parameters consistent with the present state-of-theart? |
| Extreme Conditons | Does every equaton make sense even if the inputs reach extreme values? |
| Boundary Structure Adequacy | Does the model contain the most important issues addressing a given problem? |
| Dimensional Consistency | Is every equaton dimensionally consistent without the necessity to use parameters that are non-existent in the real world? |
| Tests of Model Behavior | |
| Behaviour Reproducton | Does the model endogenously generate the symptoms of the problem, the behavior of modes, phases, frequencies and other characteristcs of the real system behavior? |
| Behaviour Anomaly | Do the anomalies occur when the model assumptons have been removed? |
| Family Member | Does the model represent the behavior of various instances of the same class objects when their input parameters have been entered? |
| Surprise Behaviour | Is the model able to identfy ‘new’ behavior that has not been known in the real system? |
| Extreme Policy | Does the model behave properly when extreme input values have been entered or when an extreme policy has been implemented? |
| Boundary Behaviour Adequacy | Is the model behavior sensitve to the additon or the change of the structure which represents reliable alternatve theories? |
| Behaviour Sensitvity | Is the model sensitve to reliable changes of parameters? |
| Statsitcal Character | Do the model outputs have the same statstcal characteristcs as the real system outputs? |
| Tests of Policy Implicatons | |
| System Improvement | Has the real system been improved as a result of the applicaton of the simulaton model? |
| Behaviour Predicton | Does the model describe correctly the results of the new policy? |
| Boundary Policy Adequacy | Are the policy recommendatons sensitve to the additon or the change of structure which represents possible alternatve theories? |
| Policy Sensitvity | Are the policy recommendatons sensitve to reliable changes of parameters? |
| Source: own study on the basis of Sterman, Appropriate Summary Statstcs for Evaluatng the Historical Fir of System Dynamics Models, 1984, p. 52. | |
It should be underlined that the choice of a test does not determine the technique by means of which it must be performed. Plenty of suggestons can be found in the works by Barlas (Barlas, 1996) or Sterman (Sterman, 2000). The authors of this artcle present some of these techniques on the example of the manufacturing resource allocaton.
Analysis and study
The model, whose validaton is to be found below, was built for an electronic company that deals mainly with manufacturing low-voltage condensers. The model purpose was to assess the long-term effect of the workforce allocaton to individual producton cells on producton process parameters as the volume of the work-in-progress products and the productvity. On the basis of the data provided by the company the authors identfed 19 producton cells. Due to their sporadic workload some of the cells were not taken into account. The cells were grouped according to their tasks. As a result, a network of 9 overlapping cells was obtained (Table 3).
| From / To | G_BL | G_IMP | G_MON | G_PIER | G_WTOR | G_KJ | G_MG | G_NP | G_ZAL |
|---|---|---|---|---|---|---|---|---|---|
| G_BL | X | X | X | X | X | X | |||
| G_IMP | X | X | X | X | X | ||||
| G_MON | X | X | X | X | X | X | X | X | |
| G_PIER | X | X | X | X | |||||
| G_WTOR | X | X | X | X | |||||
| G_KJ | X | X | X | X | X | X | |||
| G_MG | X | X | X | X | X | X | X | ||
| G_NP | X | X | X | X | |||||
| G_ZAL | X | X | X | X |
Having surveyed the staff, the researchers realized that the company did not have a consistent methodology of task distributon. Each foreman was in charge of a group of workers and allocated tasks on their own authority. The absence of clearly defned mechanisms of controlling the transfer of semi-fabricated products from one work staton to another turned out to be the key challenge in the process of the model creaton. What is more, the company never registered the number of staff working in a cell. That informaton was eventually obtained through the analysis of operatons performed by individual workers and the allocaton of the operatons to individual producton cells. This is why in the process of modeling the researchers sought the solutons that would represent as precisely as possible the number of workers employed in each cell as well as the number of semifabricated products leaving each cell.
Figure 2 shows a part of the model representng the operaton of the MG cell (inventory). This part was validated, which conforms to the aforementoned methodology of validatng individual parts of the model. Because their purpose was not to determine the number of workers assigned to a task, but to assess the applied policy, the researches set a one-month simulaton tme step. The analysis covered full 21 months. The number of workers was calculated by dividing the inventory working tme by the working tme of a single worker in a cell. In order to count the number of semi-fabricated and fnished products leaving the inventory the researchers multplied the number of batches in a given period of tme by the average number of items in a batch in that period.
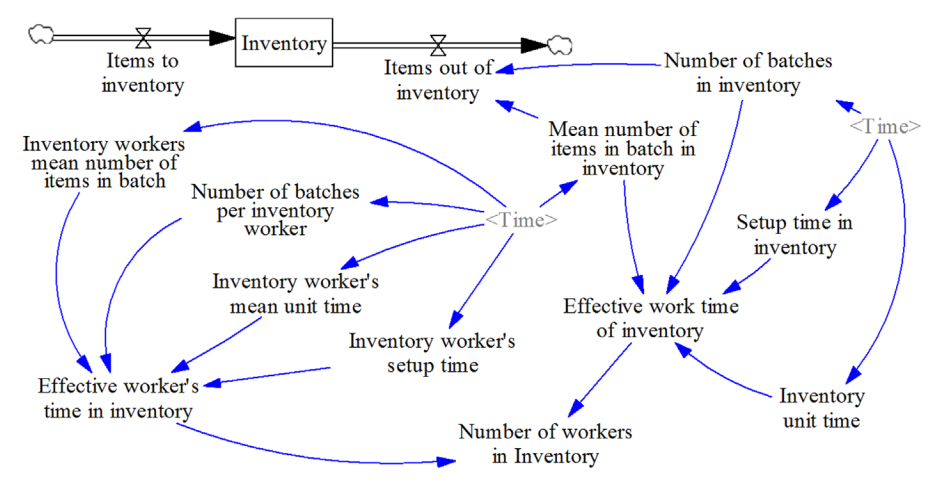
The model was tested by means of the structure and behavior tests. Since the model has not been implemented yet, the test of policy implicatons cannot be performed.
When validatng the structure the authors frst of all used the data obtained in the course of survey among the company staff. They also based their validaton on generally accepted knowledge from the reference literature.
It should be noted that the structure validaton tests are some of the most difcult ones to formalize and perform (Barlas, 1996, p. 190). The informaton which is indispensable at this stage of validaton cannot be presented just as a set of fgures. The tools used by the authors of this paper to evaluate the structure accuracy ft the requirements of Barlas’ standardS.
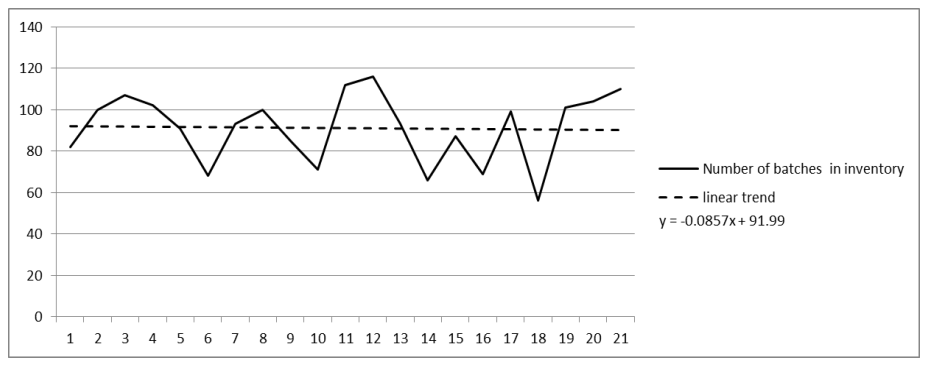
The following input parameters of the system were tested: the number of batches in the inventory (the number of batches in inventory) and the unit tme of assignments performed in the inventory (Unit tme inventory). Following the preliminary assessment of the charts (see examples in Figures 3 and 4) and the calculatons run for different types of trends, the researchers, basing on linear trends, decided to determine the values necessary to set the effectve working tme for each producton cell and the working tme of one producton cell worker. The trend equatons are shown in Table 4.
| Variable | Trend |
|---|---|
| Single worker’s working tme parameters | |
| Inventory worker’s mean number of items in batch | Y=-0.4092t+49.699 |
| Inventory worker’s mean unit time | Y=1e-05t+0.0015 |
| Number of batches per inventory worker | Y=-0.0493t+16.142 |
| Inventory worker’s setup tme | Y=-0.0062t+0.3119 |
| Parameters of producton cell effectve working tme | |
| Mean number of items in batch in inventory | Y=-2.4413t+103.76 |
| Inventory unit tme | Y=1e-05t+0.0078 |
| Number of batches in inventory | Y=-0.0857t+91.99 |
| Setup time in inventory | Y=-0.002t+0.0909 |
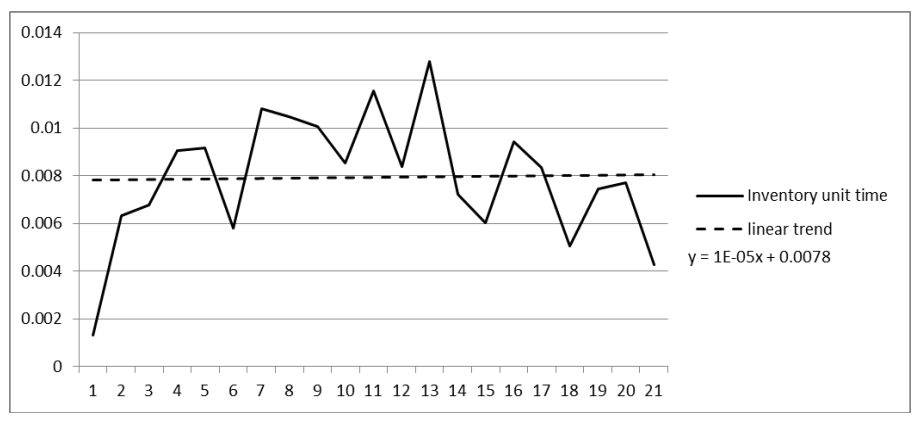
Although some fluctuatons do appear in the real system, they are not of seasonal nature. Additonally, the model is supposed to clarify the relatons between the number of workers in individual producton cell and the parameters of the producton process rather that to forecast the value of individual parameters. Therefore, in a view to the lengthy period covered by the analysis, the above fluctuatons can be considered hardly signifcant.
In the second group of tests proposed by Barlas, i.e. the valuaton of the model behavior, the authors examined, among others, the system behavior logic.
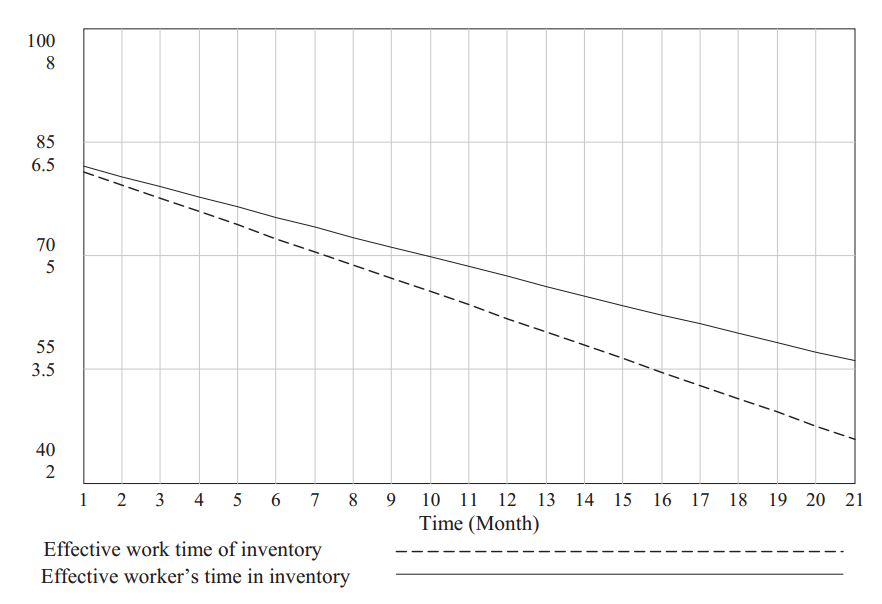
In the above discussed example they checked if the single cell worker’s working tme did not exceed the value of the effectve working tme of the producton cell itself. The chart (Figure 5), generated by the VENSIM program, shows that in this context the model can be considered reliable.
At the same tme the parameter values generated by the model were compared with those generated by the real system. In order to perform the valuaton the authors decided to use the Theil statstcs proposed in the reference literature (Kasperska, 2005, p.137).
Table 5 shows the results of the Theil statstcs for the following variables: number of items in inventory and number of workers in inventory.
| Parameter | Items out of inventory | No of workers in inventory |
|---|---|---|
| UM | 0.0027 | 0.0955 |
| US | 0.4447 | 0.8128 |
| UC | 0.5526 | 0.0917 |
| U | 1 | 1 |
The Theil statstcs parameters were supplemented with the analysis of the charts where actual data was compared with the simulated ones (Figures 6 and 7).
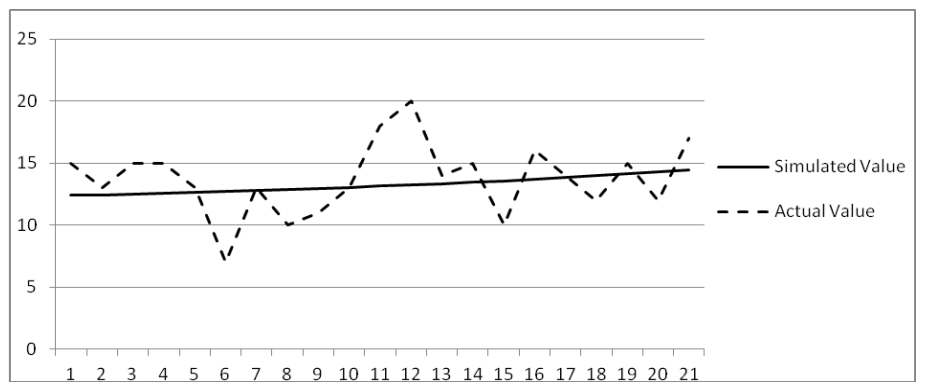
The characteristcs of the set of the Theil statstcs parameters for the variable Number of workers in inventory can be regarded as belonging to the (0, 1, 0) patern. The disturbances in the real system, as indicated in the chart, are not taken into consideraton in the model. Since, as it has been mentoned before, the purpose of the model is not to examine the periodic fluctuatons, the error can be seen as non-systematc.
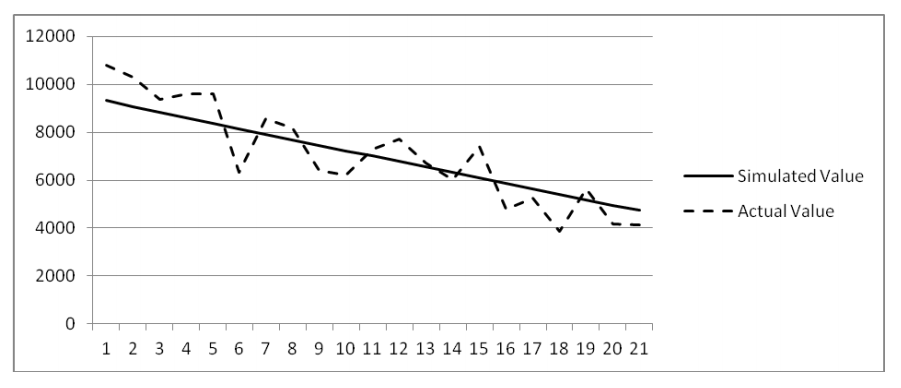
In case of the variable Items out of inventory the Theil statstcs system (1, α, 1-α) as well as the chart analysis allow us to make an assumpton that the real and simulated data have the same mean and trends, but they differ point by point and the deviatons from the real data are the effect of a nonsystematc error.
Therefore the analysis of the data and the comparison of the charts presentng the actual and simulated data lead to the conclusion that in this partcular aspect the model is burdened with a non-systematc error, thus it can be regarded as reliable.
Discussion
The above example proves that the afore discussed part of the model can be regarded as workable as far as its representaton of the real system is concerned. Admitedly, we can assume that if the model has turned out reliable in case of one producton cell, the same computaton scheme will be applicable to the others. But if we want to prove beyond any doubt that the whole model is reliable, we should expand the validaton over all the remaining cells. Moreover, the elements that are linking individual cells should be tested as well. First of all, however, we should fnd out if the total number of workers in all the producton cells does not exceed the number of workers in the company. In additon, the work-in-progress in any of the cells cannot reach negatve values.
We should also make certain that the values adopted as data are obtained from the IT system currently operatng in the company. In order to improve the reliability of computatons it is worth considering the introducton of additonal parameters - such as the tme a single worker spends in a producton cell - to the company records.
At the same tme it seems worthwhile to prolong the period of tme covered by the analysis – it could result in beter leveling off the fluctuatons occurring in the real system.
Conclusion
Summarizing, it is worth notng that the defnitons of validaton include such expressions as ‘a satsfying level of accuracy’ or ‘in keeping with the model’s intended use’, which are subjectve phrases. It means that whether a model is considered reliable or not will largely depend on the judge’s impression (Sargent, 1998). What is more, neither verifcaton nor validaton is absolute, so we are not able to decide if the model has been verifed or validated in 100%. Therefore, we cannot acknowledge that it is reliable unless we have run as many tests as necessary (Carson, 2002, p. 52). Although the model can be tested at different stages of its creaton by various people (such as the modeler or an independent expert), the truth is that it is its user who will eventually decide how effectvely the model helps them in their decisionmaking.
References
- Ranganath, B. (2008). System dynamics: Theory and case sudies. New Dehli: I. K. Internatonal Publishing House.
- Balcerak, A. (2003). Walidacja modeli symulacyjnych – źródła postaw badawczych. Prace Naukowe Instytutu Organizacji i Zarządzania Politechniki Wrocławskiej, 74(15), 27-44.
- Balci, O. (1986). Creditbility assessment of simulaton results: The state of the art. Proceedings of the Conference on Simulaton methodology and Validaton. San Diego: The Society for Computer Simulaton.
- Barlas, Y. (1996). Formal aspects of model validity and validaton in system dynamics. System Dynamics Review, 12(3), 183-210.
- Campuzano, F. i Mula, J. (2011). Supply chain simulaton: a system dynamics approach for improving performance. New York: Springer.
- Carson, J. S. (2002). Model verifcaton and validaton. Proceedings of the 2002 Winter Simulaton Conference, (strony 52-58). San Diego.
- Davis, P. (1992). Generalizing concepts and methods of verifcaton, validaton and accreditaton (VV&A) for military simulatons. Santa Monica: RAND.
- Jaszkiewicz, A. (1997). Inżynieria oprogramowania. Gliwice: Helion.
- Kasperska, E. (2005). Dynamika systemowa - symulacja i optymalizacja. Gliwice: Wydawnictwo Politechniki Śląskiej.
- Łatuszyńska, M. (2008). Symulacja komputerowa dynamiki systemów. Gorzów Wielkopolski: Wydawnictwo Państwowej Wyższej Szkoły Zawodowej.
- Maciąg, A., Pietroń, R. i Kukla, S. (2013). Prognozowanie i symulacja w przedsiębiorstwie. Warszawa: PWE.
- Martis, M. (2006). Validaton of simulaton based models: A theoretcal outlook. The electronic Journal of Business Research Methods, 4(1), 39-46.
- Pidd, M. (1998). Computer simulaton in management science. Chichester: John Willey & Sons.
- Robinson, S. (1997). Simulaton model verifcaton and validaton: Increasing the users confdence. Proceedings of the 1997 Winter Simulaton Conference, (strony 53-59). Atlanta.
- Sargent, R. (1998). Verifcaton and validaton of simulatons models. Proceedings of the 1998 Winter Simulaton Conference, (strony 121-130). Washington.
- Sargent, R. (2010). Verifcaton and validaton of simulaton models. Proceedings of the 2010 Winter Simulaton Conference, (strony 166-183). Baltmore.
- Sterman, J. (1984). Appropriate summary statstcs for evaluatng the historical ft of system dynamics models. Dynamica, 10(II), 51-65.
- Sterman, J. (2000). Business Dynamics System Thinking and Modeling for a Complex World. New York: McGraw-Hill.
- Tarajkowski, J. (2008). Elementy dynamiki systemów. Poznań: Wydawnictwo Akademii Ekonomicznej w Poznaniu.


